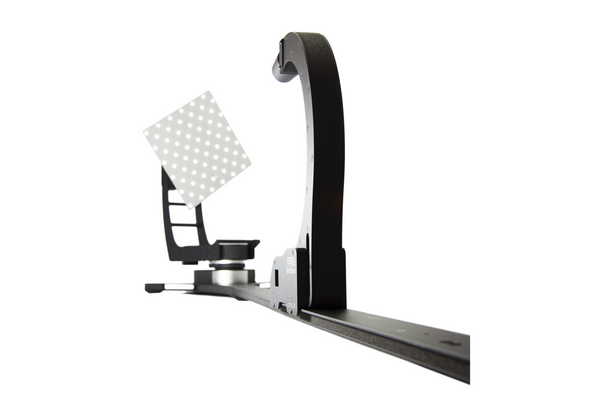
BaseSpion Light Measurement System
Regular price
$0.00
Unit price per
Description
The bench-top BaseSpion® light measurement equipment is a great tool for any photometric laboratory. It allows you to measure all medium-sized lighting products.
The 2-axis goniometer allows the system to measure the full 3D distribution field of any lamp or fixture and to provide your clients with comprehensive XLS and IES simulation files.
The BaseSpion light measurement system is the perfect solution for any medium-size laboratory that needs advanced light measurements in a compact system. The solution is ideal for measuring LED chips, modules, panels, downlights, bulbs and spots.
The design of the system makes it very flexible to work with in any lighting laboratory. The power analyzer and the goniometer drivers are all built in. Just connect via USB to any PC and obtain results in 30 seconds. The BaseSpion is easily connected to your computer via a USB connector. The Viso Light Inspector software is available for download from this website. The user interface displays the measured data in a clear and simple way, while allowing for more detailed investigation of the obtained data.
Installation
The light source is easily mounted on the goniometer and rotation of the lamp is both fast and silent. The BaseSpion handles light sources up to 9 kg and 560 mm in diameter.
The installation process is very simple too. Place and level the base of the BaseSpion on a steady surface, preferably in a dark room. Mount the goniometer arm and the spectrometer sensor on the base and the system is fully operable within 20 minutes. To obtain accurate results it is necessary to eliminate possible reflections from the experimental environment, so placing a black backdrop behind the system is advised.
The distance between light source and sensor is detected automatically.
The BaseSpion light measurement equipment is then ready for measurement. Install the Viso Light Inspector Software, connect your laptop to the base via the USB-port and start measuring. The process is entirely automatic with the option of manual operation. Data collection from a single C-plane only takes about 20 seconds.
Measurement data is then automatically saved in a specific folder in the form of fixture files. They are usually exported into PDF, PNG, IES, XLS and CSV formats for further presentation in reports. Viso Systems supports customers with comprehensive backup and problem solving, and our distributors and engineers are ready to help on site, via email or phone.
Advantages
- Measures light sources up to 9 kg/ Ø56 cm
- Fits into relatively small laboratories
- All color and lumen data – no integrating sphere needed
- An advanced system which is very easy to operate
- Output as customizable reports or raw data
- Can be upgraded to include ultraviolet light: BaseSpion UV-VIS and UV-VIS-NIR
Applications
General Lighting
Light Sources and LED
Horticulture
Specifications
| Model No. |
BaseSpion |
|---|---|
| Measurement method |
Far field, type C horizontal |
| Standard spectrometer range | Standard 360 – 830 nm (other ranges available) |
| Sensor distance range | 350 mm to 4500 mm (1.15 ft to 14.7 ft) |
| Sensor distance setup |
Manual placement Automatic detection |
| Light source diameter range |
0 – 540 mm @ 2-axis (0 – 1.8 ft @ 2-axis) |
| Light source maximum weight | 9 kg (19.8 lbs) |
| Power supply input |
90 to 260 VAC, 50/60 Hz |
| Outputs |
Lumen, Peak candela, CCT, Spectrum, CRI, TM30, CQS, Beam angle, 3D Light distribution, Power specs, lm/W, etc. |
Basic Outputs
Light distribution curve

With high measurement detail there is data in abundance to plot. Measure up to 72 C-planes and up to 0.1-degree gamma resolution. 3D plots are included as well
Spectrum

As light is detected with a Viso fast spectrometer sensor, spectral data is recorded in every measurement point. Working with a specific part of the spectrum – e.g. just around 254 nm – is easy with the software “range” option
IES/XLS files for light planning

Measuring 3D light distributions enables you to simulate UV lighting distributions and generate high level iso-irradiance diagrams.
Dose maps

In germicidal applications, exposure time is the one thing that matters. How much time is necessary to kill a specific germ?
The Viso software gives you a fast overview with automated dose maps.
Further Outputs
Fundamental radiation data
- Total lumen or mW
- Peak Emission Wavelength (λp)
- Peak Irradiance (@ distance 1 m)
- UV Irradiance at all wavelengths (@ any distance)
- Polar light distribution curves
- Linear light distribution curves
Visible light data
- CCT / Correlated Color Temp. [K]
- CRI / Color Rend. Index / Ra (1-14)
- TM30-18 indices and graphics
- CQS index and graphics
- CIE 1931 x,y-diagram and Duv
- SCDM (MacAdam steps)
Lighting design and data export
- UGR table
- Isolux/iso-irradiance plots
- UVA / UVB / UVC split
- Full raw data export to MS Excel etc.
- Dose evaluation plots
- Customizable PDF reports
Power and warm-up data
- Wattage [W]
- Current [A] and voltage [V]
- Mains frequency [Hz]
- Current and voltage THD [%]
- Warm-up time and variation
- Automatic stabilization
Downloads


